Create a formatted heatmap from PubMatrix results
Source:R/heatmap_functions.R
plot_pubmatrix_heatmap.RdThis function creates a heatmap displaying overlap percentages derived from a PubMatrix result matrix, with Euclidean distance clustering for rows and columns.
Usage
plot_pubmatrix_heatmap(
  matrix,
  title = "PubMatrix Co-occurrence Heatmap",
  cluster_rows = TRUE,
  cluster_cols = TRUE,
  show_numbers = TRUE,
  color_palette = NULL,
  filename = NULL,
  width = 10,
  height = 8,
  cellwidth = NA,
  cellheight = NA,
  scale_font = TRUE
)
Arguments
- matrix
A data frame or matrix from PubMatrix results containing publication co-occurrence counts
- title
Character string for the heatmap title. Default is "PubMatrix Co-occurrence Heatmap"
- cluster_rows
Logical value determining if rows should be clustered using Euclidean distance. Default is TRUE
- cluster_cols
Logical value determining if columns should be clustered using Euclidean distance. Default is TRUE
- show_numbers
Logical value determining if overlap percentage values should be displayed in cells. Default is TRUE
- color_palette
Color palette for the heatmap. Default uses a red gradient color scale
- filename
Optional filename to save the heatmap. If NULL, displays the plot
- width
Width of saved plot in inches. Default is 10
- height
Height of saved plot in inches. Default is 8
- cellwidth
Optional numeric cell width for pheatmap (in pixels). Default `NA` lets pheatmap auto-size.
- cellheight
Optional numeric cell height for pheatmap (in pixels). Default `NA` lets pheatmap auto-size.
- scale_font
Logical value determining if font size should scale with cell size. Default is TRUE
Details
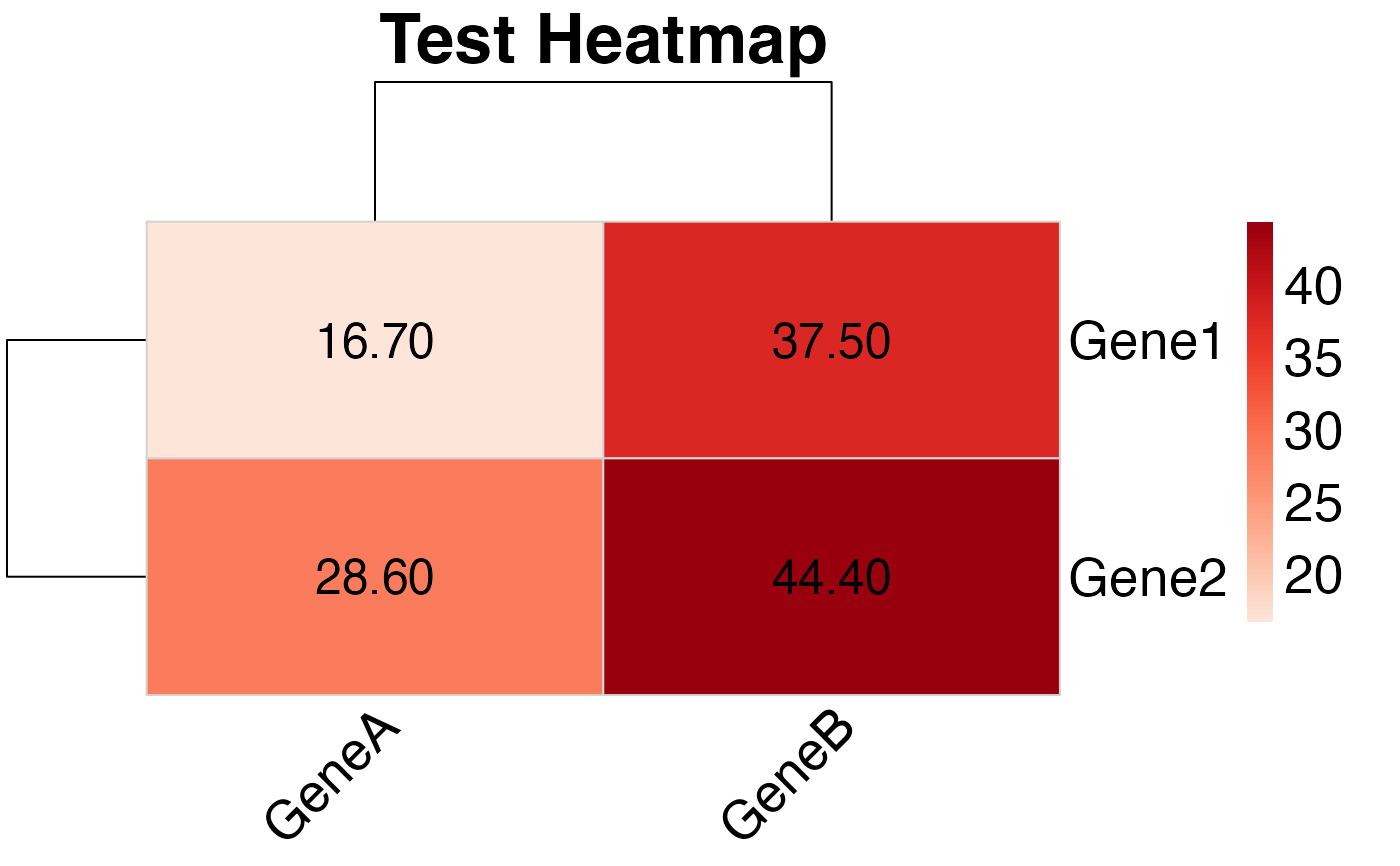
The function displays overlap percentages in heatmap cells and uses Euclidean distance for clustering rows and columns. Overlap percentages are computed from the observed co-occurrence counts using `intersection / union * 100`, where the union is derived from row and column totals. NA values in the input matrix are converted to 0 before calculation to ensure stability.
Examples
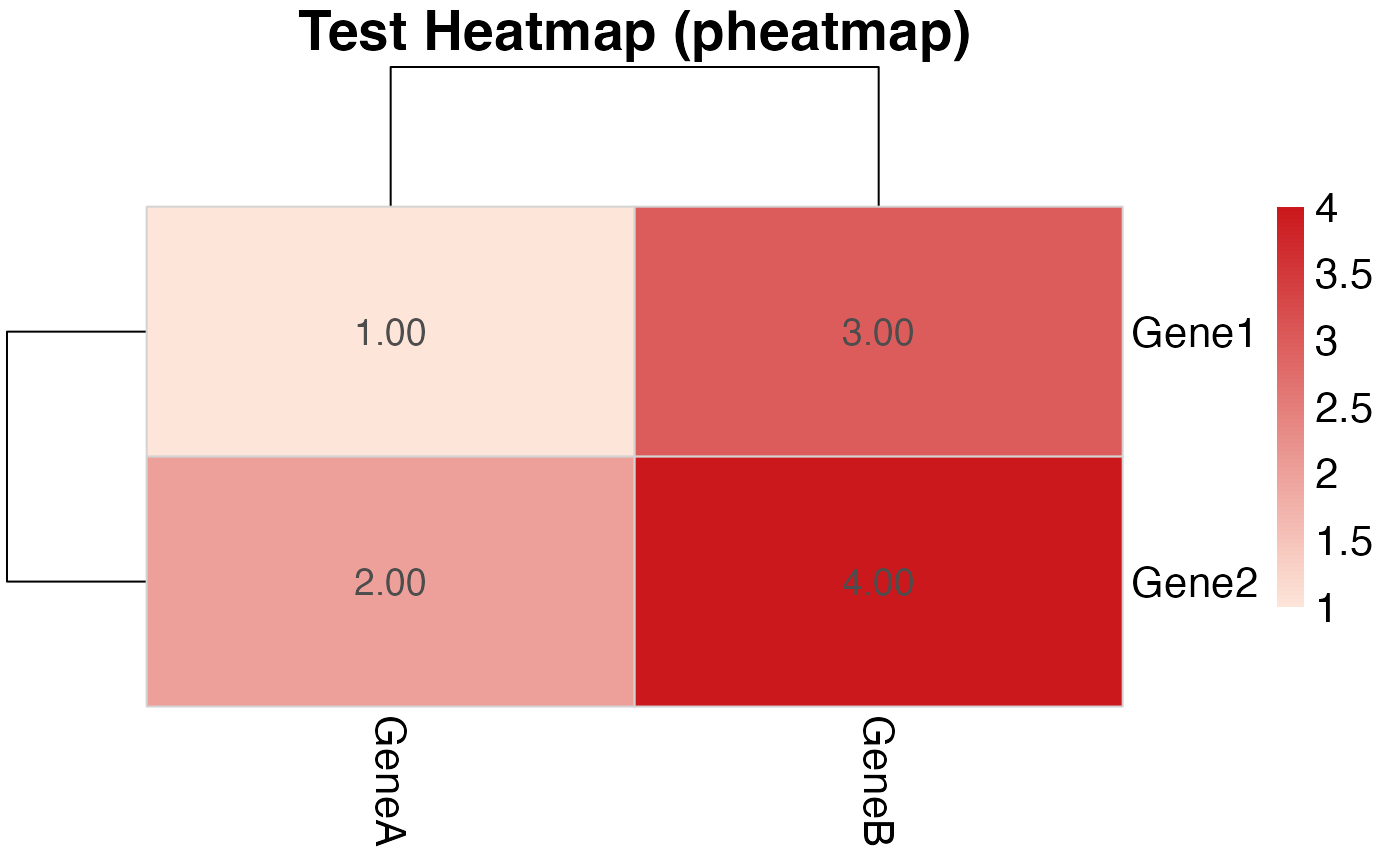
# Create a small test matrix
test_matrix <- matrix(c(1, 2, 3, 4), nrow = 2, ncol = 2)
rownames(test_matrix) <- c("Gene1", "Gene2")
colnames(test_matrix) <- c("GeneA", "GeneB")

# Create heatmap using the helper
plot_pubmatrix_heatmap(test_matrix, title = "Test Heatmap")


# Equivalent using pheatmap directly:
# Compute overlap matrix as the function does (here trivial because counts are raw)
overlap_matrix <- test_matrix
pheatmap::pheatmap(
  overlap_matrix,
  main = "Test Heatmap (pheatmap)",
  color = colorRampPalette(c("#fee5d9", "#cb181d"))(100),
  display_numbers = TRUE,
  fontsize = 16,
  fontsize_number = 14,
  border_color = "lightgray",
  show_rownames = TRUE,
  show_colnames = TRUE
)
# Equivalent using pheatmap directly:
# Compute overlap matrix as the function does (here trivial because counts are raw)
overlap_matrix <- test_matrix
pheatmap::pheatmap(
overlap_matrix,
main = "Test Heatmap (pheatmap)",
color = colorRampPalette(c("#fee5d9", "#cb181d"))(100),
display_numbers = TRUE,
fontsize = 16,
fontsize_number = 14,
border_color = "lightgray",
show_rownames = TRUE,
show_colnames = TRUE
)