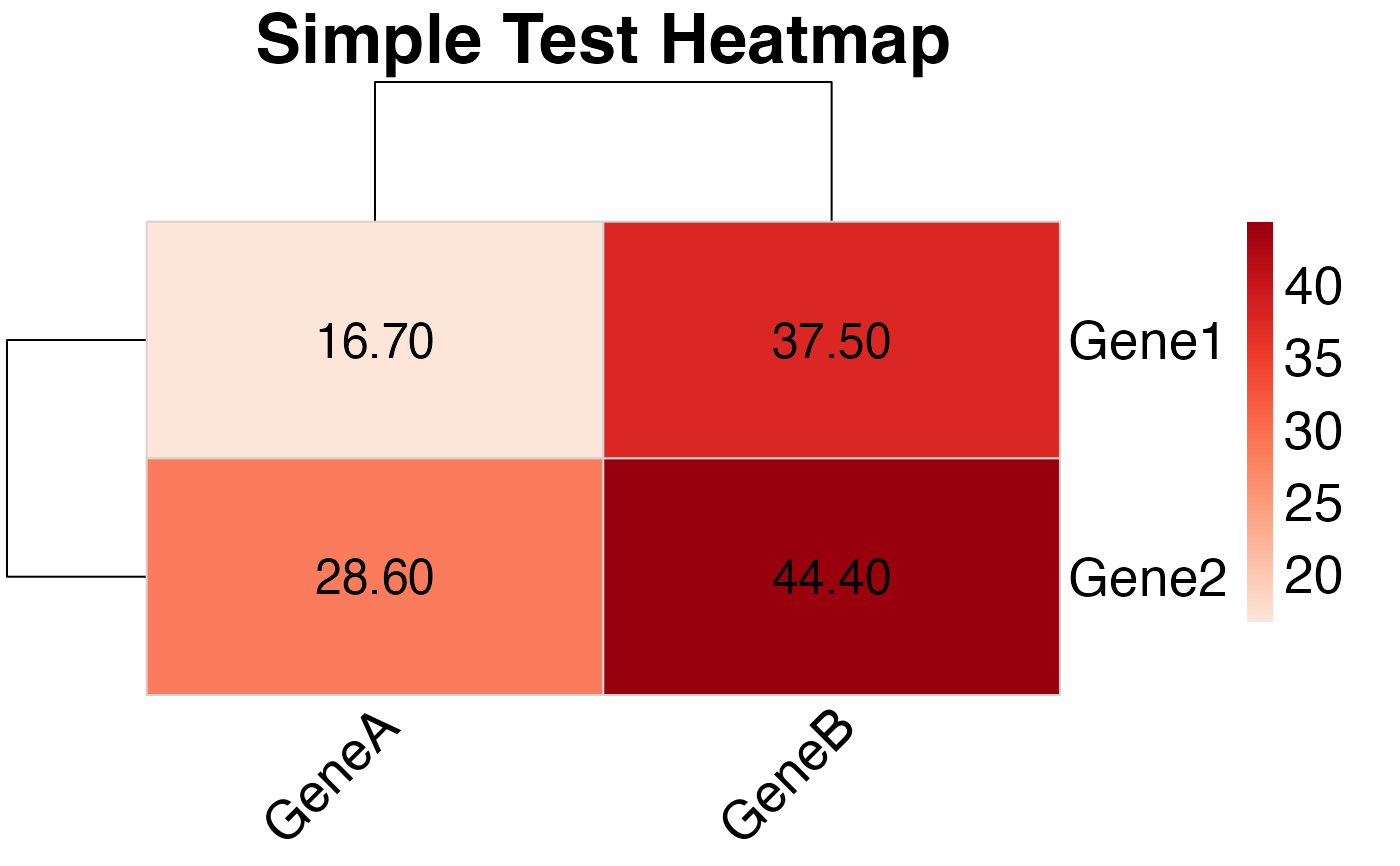
A simplified version of plot_pubmatrix_heatmap for quick visualization
Examples
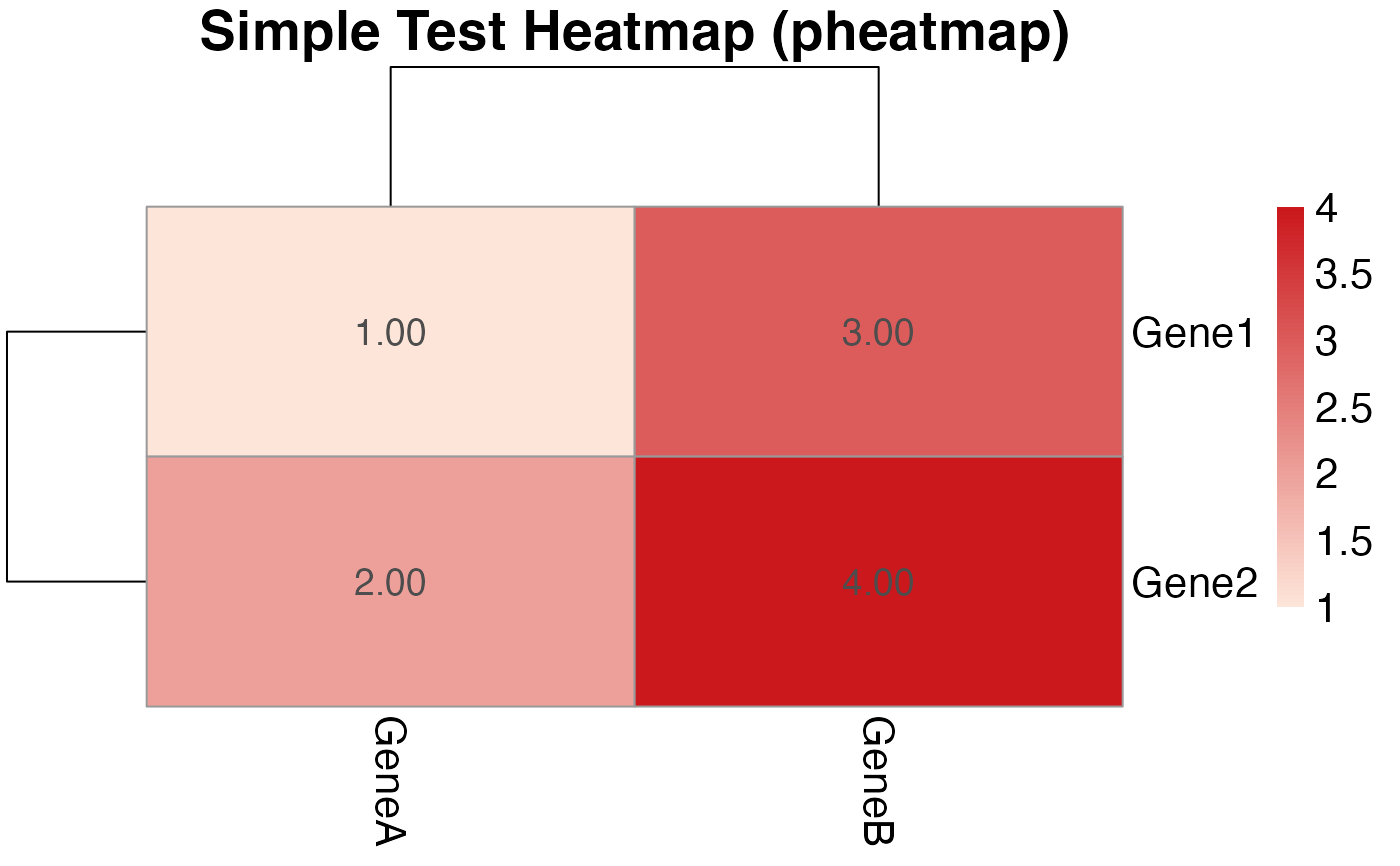
# Create a small test matrix
test_matrix <- matrix(c(1, 2, 3, 4), nrow = 2, ncol = 2)
rownames(test_matrix) <- c("Gene1", "Gene2")
colnames(test_matrix) <- c("GeneA", "GeneB")

# Create simple heatmap (wrapper)
pubmatrix_heatmap(test_matrix, title = "Simple Test Heatmap")


# Equivalent pheatmap call
pheatmap::pheatmap(
  test_matrix,
  main = "Simple Test Heatmap (pheatmap)",
  color = colorRampPalette(c("#fee5d9", "#cb181d"))(100),
  display_numbers = TRUE,
  fontsize = 16,
  fontsize_number = 14
)
# Equivalent pheatmap call
pheatmap::pheatmap(
test_matrix,
main = "Simple Test Heatmap (pheatmap)",
color = colorRampPalette(c("#fee5d9", "#cb181d"))(100),
display_numbers = TRUE,
fontsize = 16,
fontsize_number = 14
)